Urban Crowd Prediction
Spatial Data Analysis and Machine Learning
OVERCROWDED ISSUE IN CITIES
According to the United Nations population estimates and projections, by 2050, up to two-thirds of the global population (approximately 5 billion people) will reside in urban areas. The overwhelming population has led to social and safety issues. Managing crowd congestion in highly dense cities is considered a crucial task in urban governance as it can impact public safety. Some cities have started collaborating with telecommunications companies to monitor the crowd instantaneously . However, reliable prediction methods are still lacking. In the absence of accurate predictions of crowd movements, governments are unable to anticipate the timing and scale of crowd occurrences, leading to ineffective control methods.
In order to make valid predictions about the crowds, a monitoring system is developed in the present study. The system is designed to collect several kinds of crowd-related data automatically or input manually. This breakthrough has the ability to significantly expand prediction time and therefore improve the efficiency of urban governance.
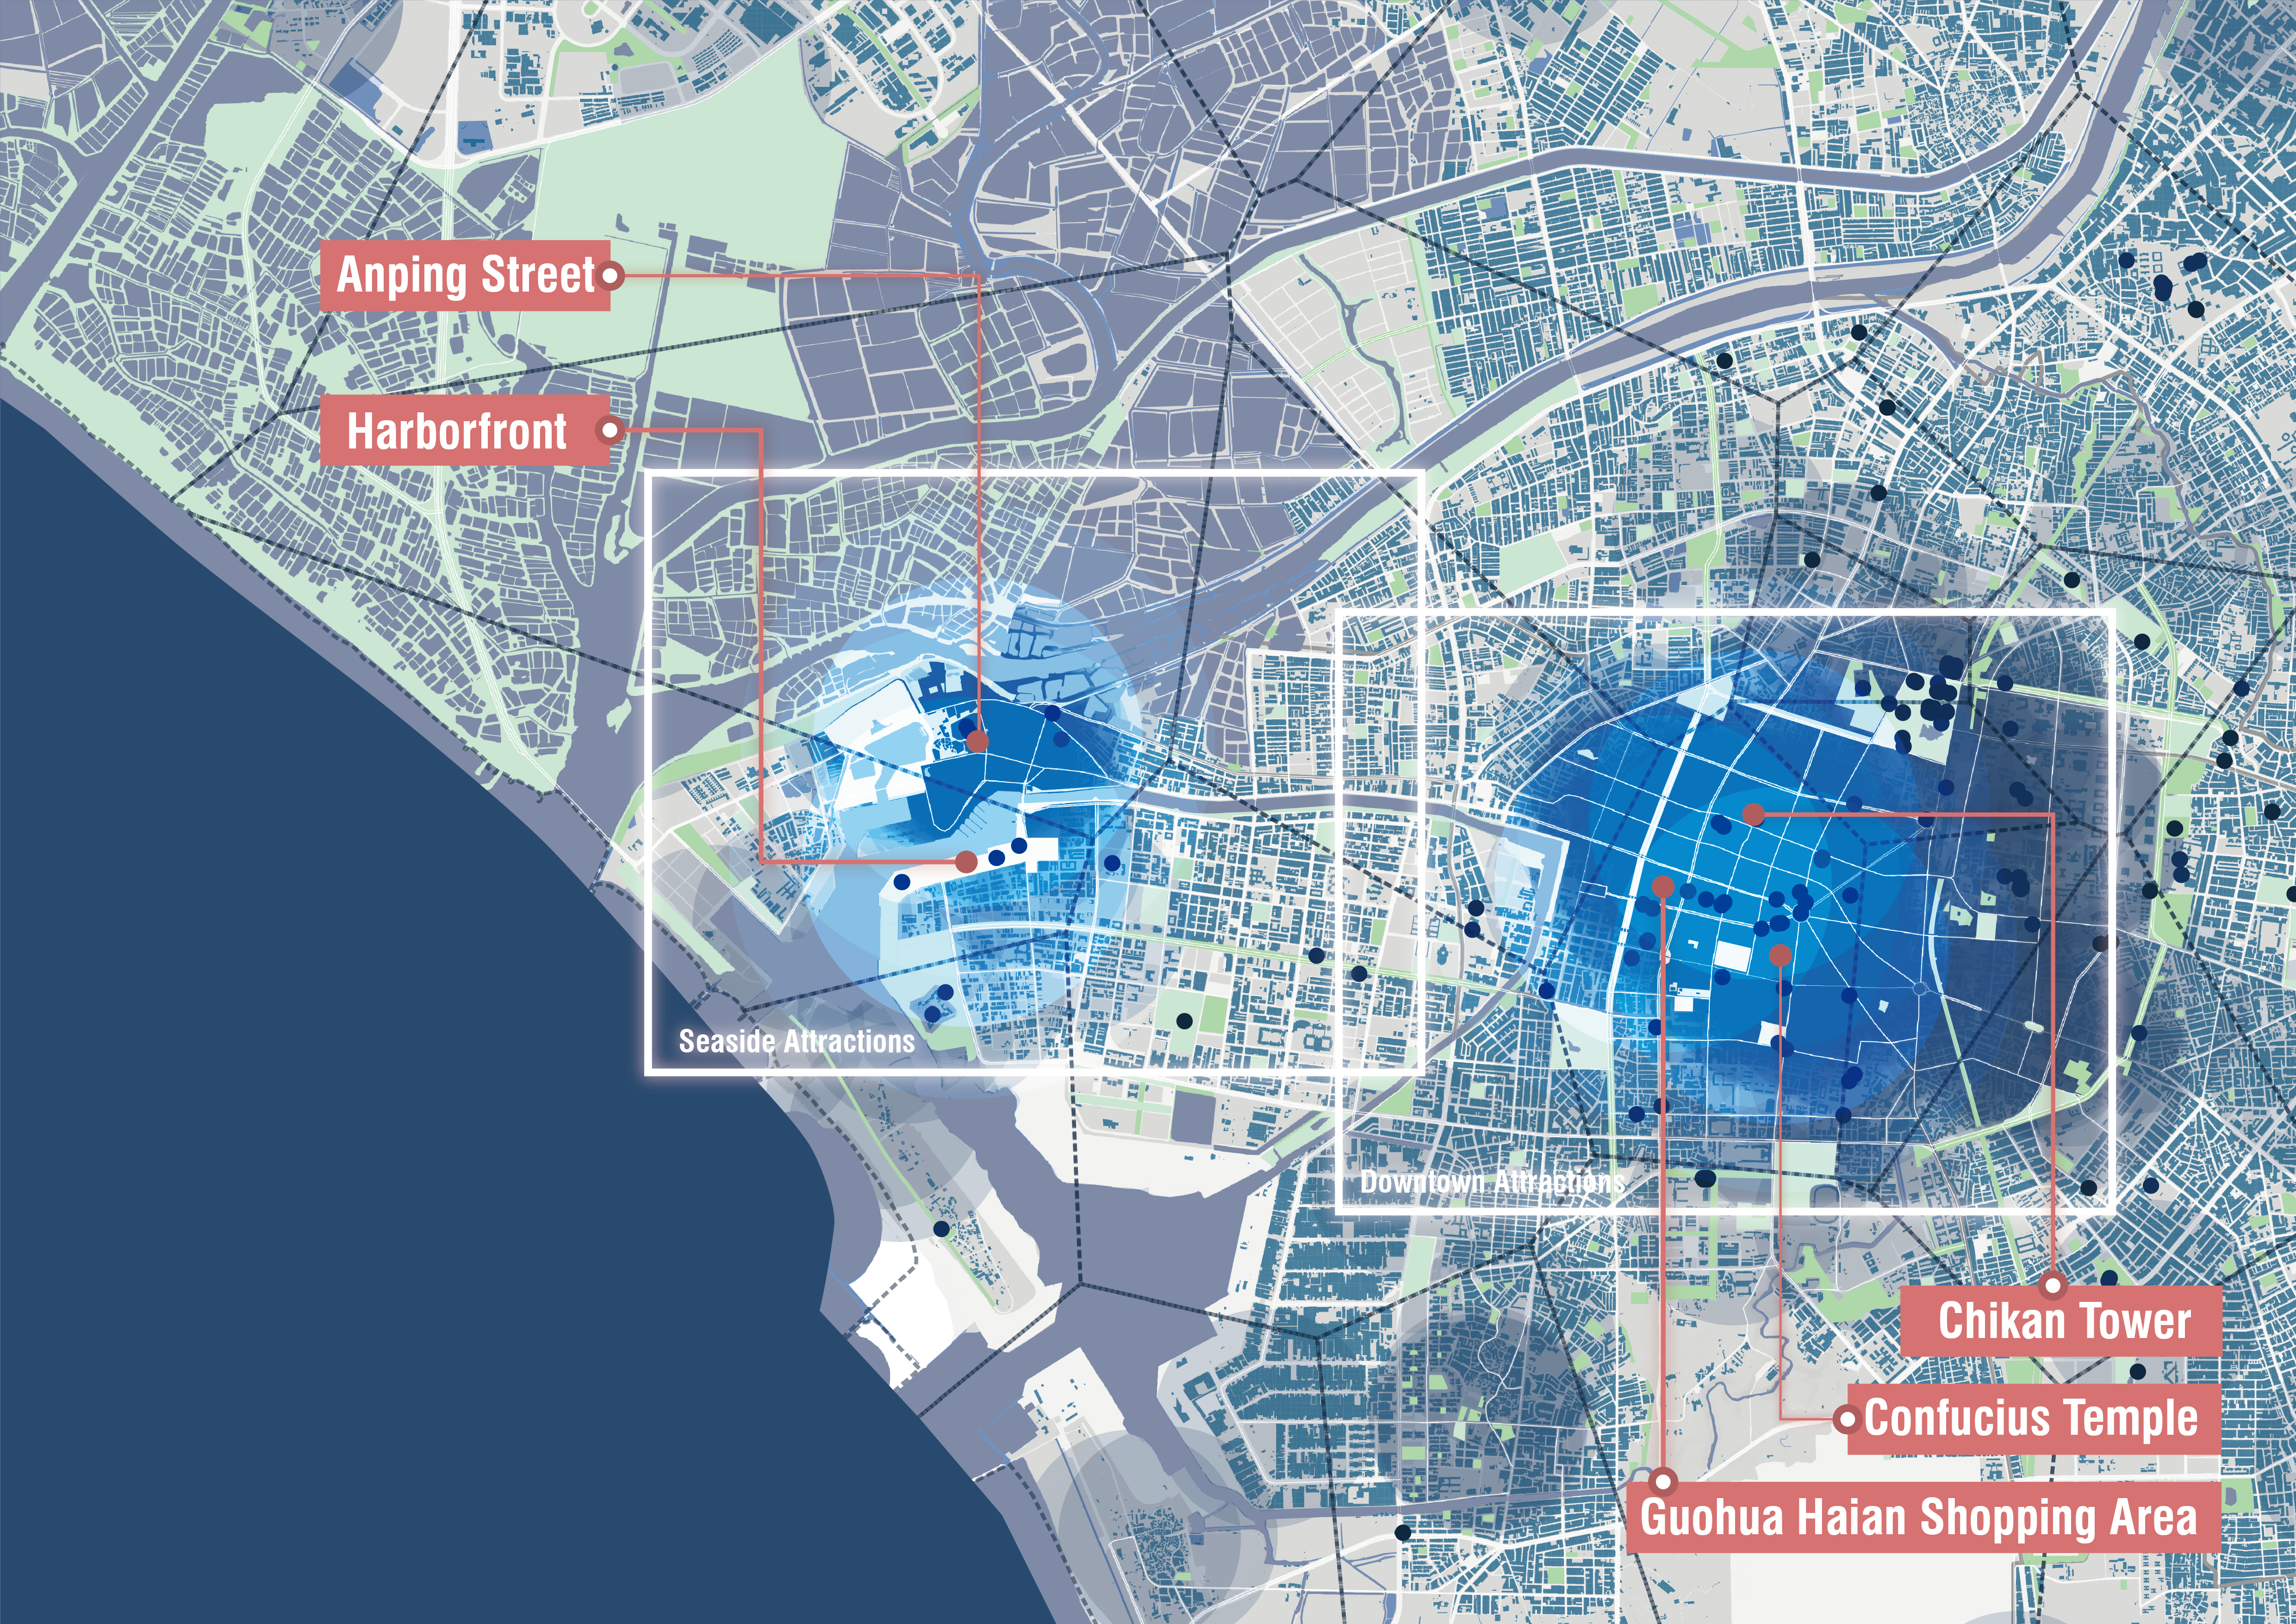
STUDY DOMAIN & RESEARCH PROCESS
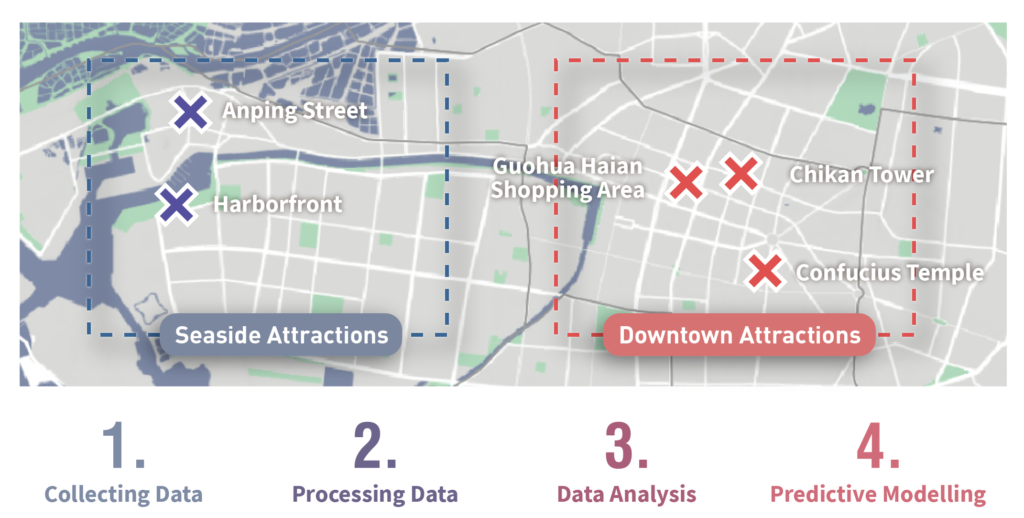
- Collecting Data: This research relys on data from various resources, including: public open data, authority restricted data, climate observation data from laboratory.
- Processing Data: Due to the large volume of data from various sources, it is necessary to first integrate the data into an analyzable format before conducting data analysis.
- Data Analysis: Through EDA (exploratory data analysis), it is possible to uncover causal relationships in events, enabling the development of effective strategies.
- Predictive Modelling: Finally, by inputting the data into machine learning models, it can accurately predict the occurrence of populations, which will aid urban governance.
STEP1. COLLECTING DATA
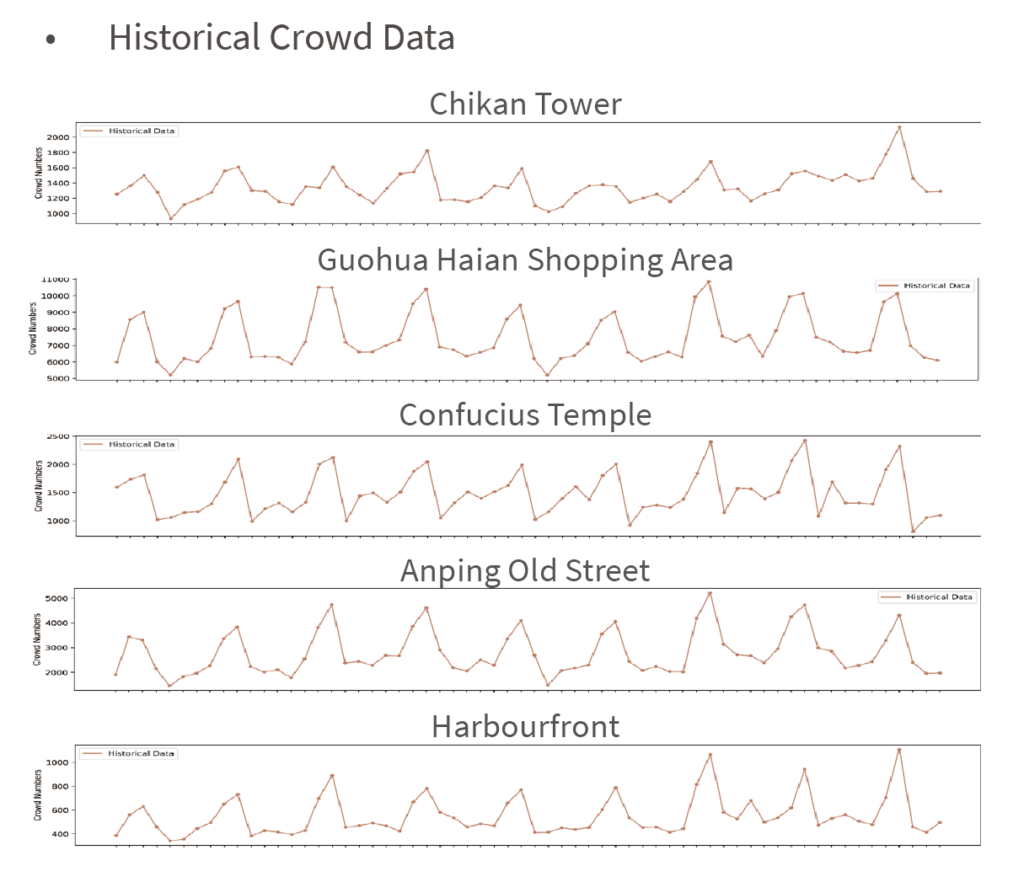
Five types of data were utilized as input factors in this study, including historical crowd data converted by telecommunications data, attractions ticket sales volume, events and holidays schedule, weather observation data (including air temperature and rain amount), and parking space availability. These data were selected due to our hypothesis that they might directly reflect crowd size or be related to people’s inclination to gather. They were considered as features which affecting the crowds or related with cowds.
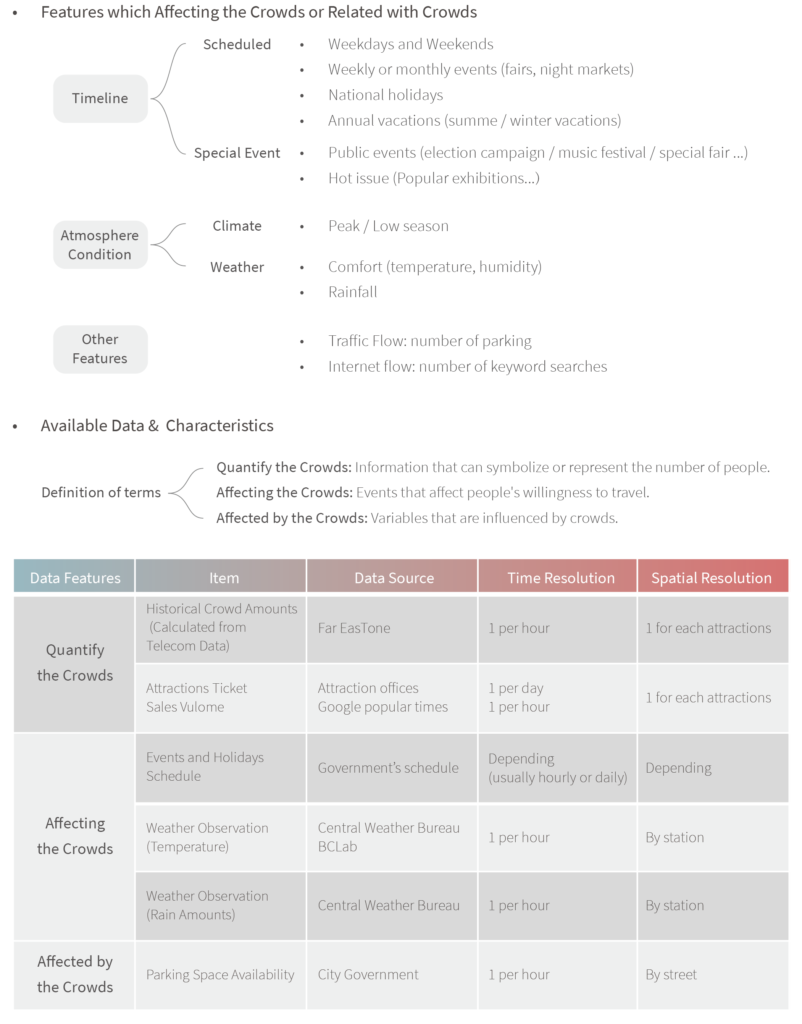
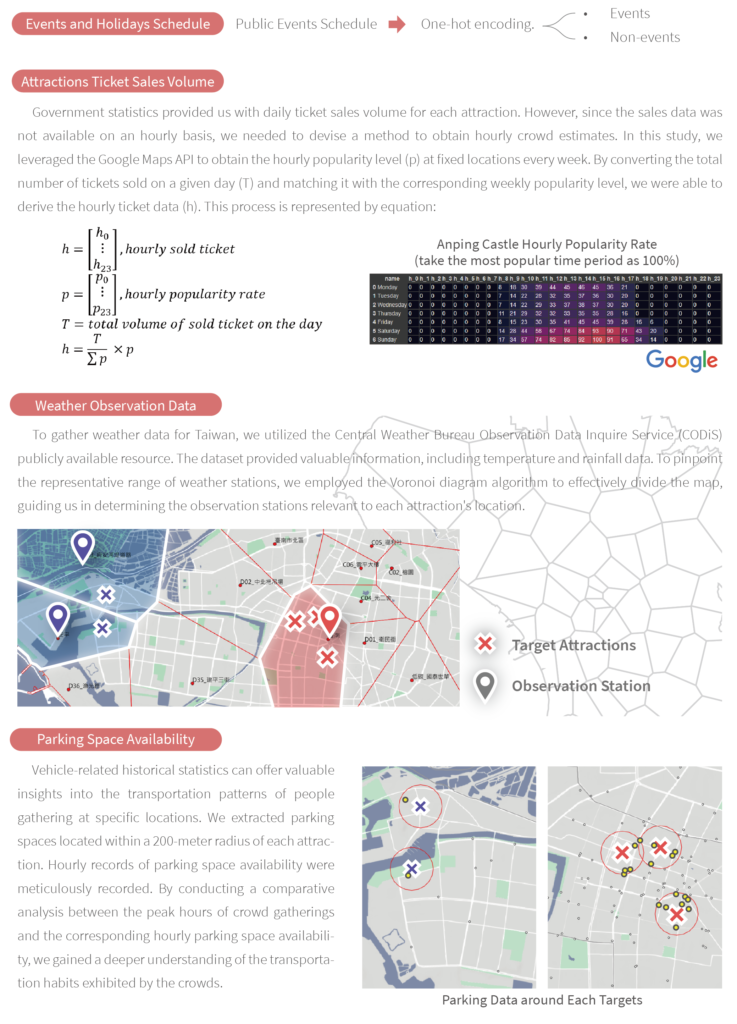
STEP2. PROCESSING DATA
To analyze the collected data, it is essential to integrate these data into a format suitable for analysis. The varying temporal
and spatial resolutions of the data necessitate different processing methods. Ultimately, these data should be made
available for comparison with the hourly crowd data calculated from telecommunication data.
3. DATA ANALYSIS
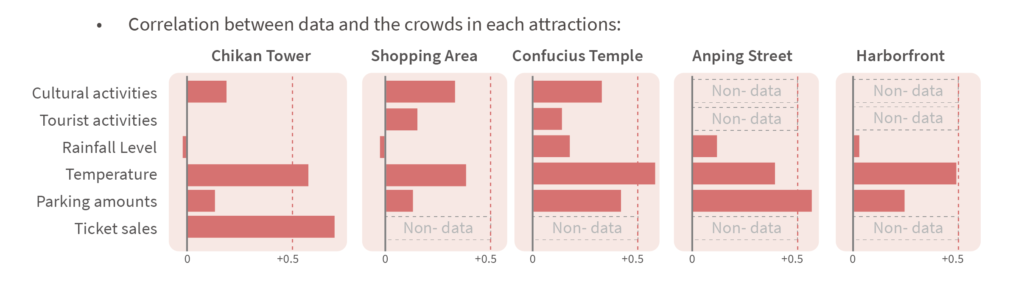
The correlation analysis showed a clear trend. The Chikan Tower ticketing data and the tourists amounts showed a correlation of +0.8, which indicates a high positive correlation between the telecom data and the sold tickets. This verified the reliability of the telecommunication data.
On the other hand, the temperature and the tourists amounts showed a fairly significant positive correlation; and the cultural activities showed a better correlation with the number of tourists. As for the usage of parking spaces, the Confucius Temple and the Harborfront showed a high correlation with the number of people, which means that tourists are more likely to choose on-street parking spaces in these areas.
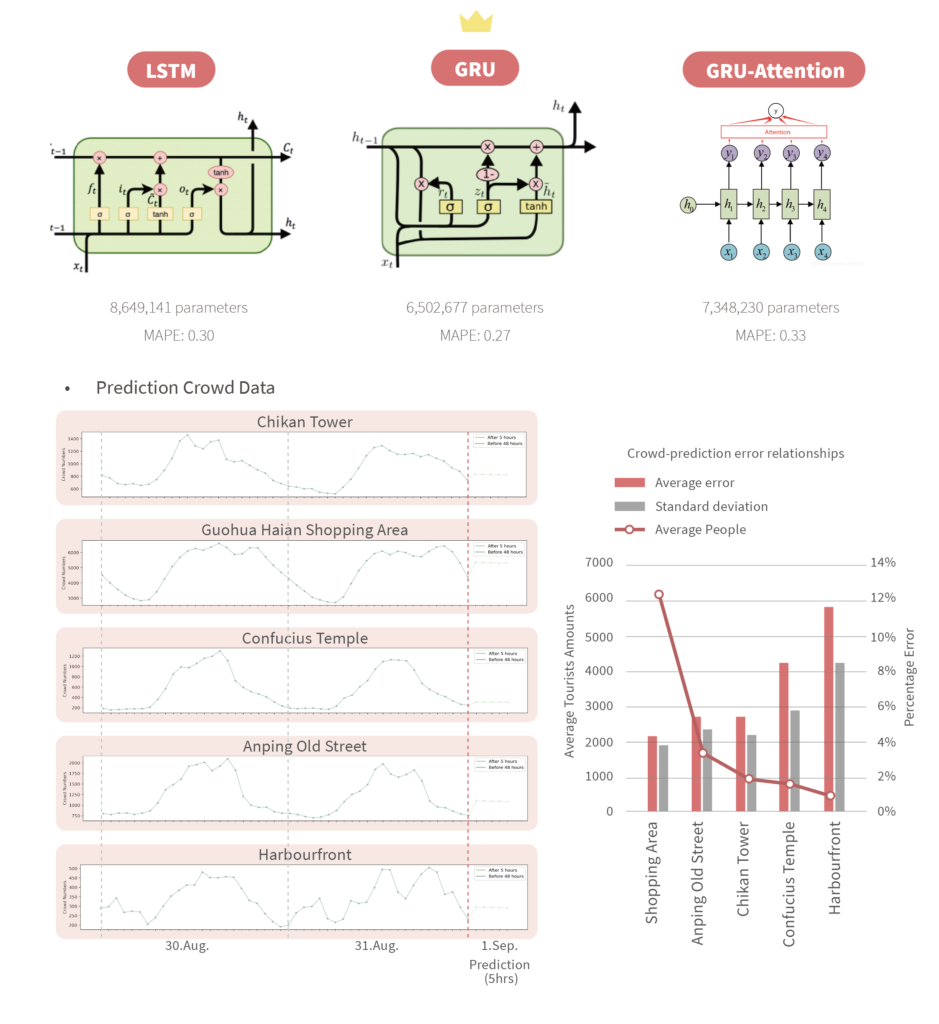
4. PREDICTIVE MODELLING
5. APPLICATION & DEMO
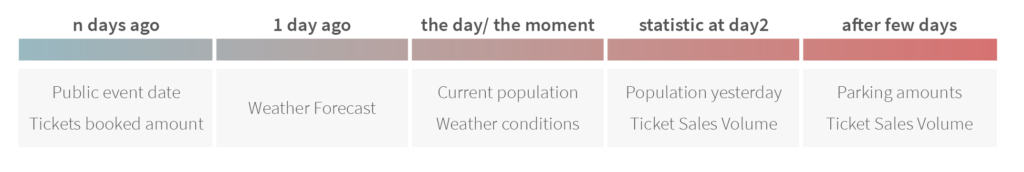
The crowd volume prediction model revealed the potential timeframe for data acquisition and its relationship with model training. Some data was able to be acquired before the present moment, including event dates and times, pre-sale ticket quantities for events like concerts, and weather forecast data provided by the Central Weather Bureau (available one day prior). Real-time updated data sources within government agencies, such as real-time tourist flow data, current weather observations were readily accessible. Additionally, agencies compiled relevant statistical data daily or monthly, like total daily ticket sales for tourist attractions or monthly revenue reports. Integrating these diverse datasets into a seamless flow model, along with manual input parameters, ensured efficient and accurate model training. In the future, establishing a comprehensive data flow system by the municipal government is expected to enable real-time monitoring and precise forecasting with continuous optimization.
Demo System
In order to introduce this research into urban governance, the system was segmented into three core pages: the Map, Statistics, and Event Scheduling. The Map page offered insights into historical, present, and predictive crowd distributions, along with other geographic data. The Statistics page showcased the movement of individuals at specific sites during designated times. Meanwhile, the Event Scheduling page allowed users to view and edit historical and future event schedules.
Administrators were able to select the desired data targets, such as historical data intervals, attractions, and prediction time (1-5 hours), among others. Whether the users used the system website for analyzing historical data, predicting future trends, or exploring geographical patterns, our application provided a robust and user-friendly platform for efficient data exploration and visualization.