Urban Ventilation System – Wind Corridor
Urban Climatical Data Analysis and Application
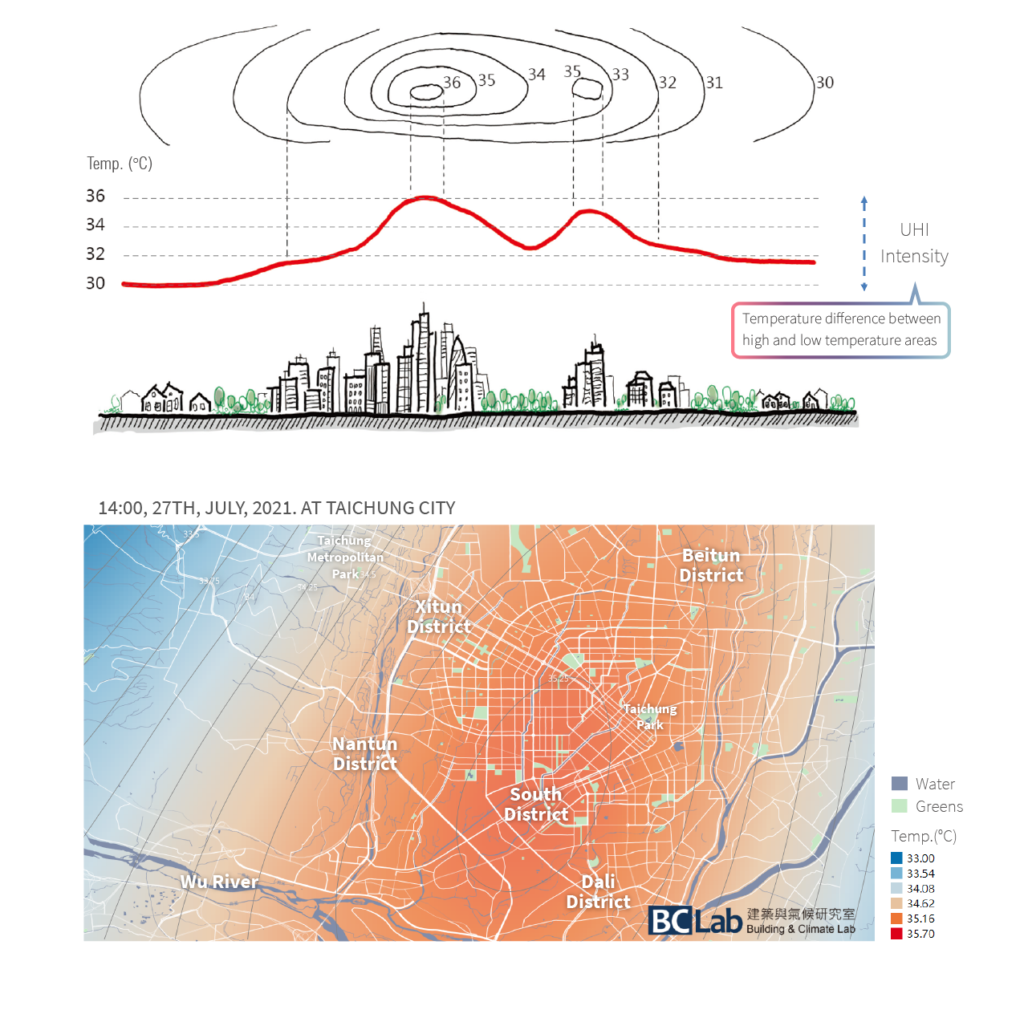
URBAN HEAT ISLAND EFFECT
The problem of urban heat island (UHI) effects has become more and more serious in many cites around the world. The intensity of UHI is based on the temperature difference between the highest and lowest temperature reigions in a city over the same period. Take London as an example, the temperature difference between the urban and suburban areas has dramatically increased from 2.1°C to 8.6°C since the 1820s, which indicates the rapid deterioration of UHI intensity.
As for Taiwan, my hometown, the UHI intensity in many cities is now generally over 2.5°C in summer, which is higher than our end-of-century temperature predictions and imaginations. At 2 pm on 29 August 2021, for example, the highest temperature in Taichung was 34.6°C in Dali District, while the lowest temperature in the plain was 30.8°C in Dajia District, with a UHI intensity of about 3.8°C. On the other hand, the Taiwan ReAnalysis Downscaling data shows that the maximum average temperature in Taichung at 2 pm in July was 33.8°C in Dali, compared to 30.3°C in Taichung Metropolitan Park in the suburbs of Shalu, demonstrating a difference of 3.5°C in UHI intensity.


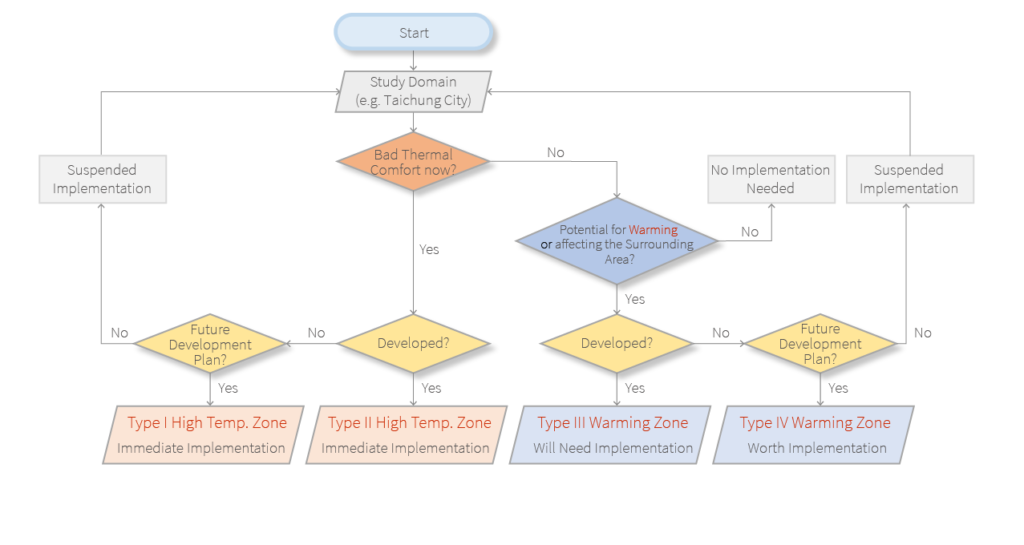
To implement these strategies, I planned a selection process to choose the key demonstration areas:
WIND CORRIDORS
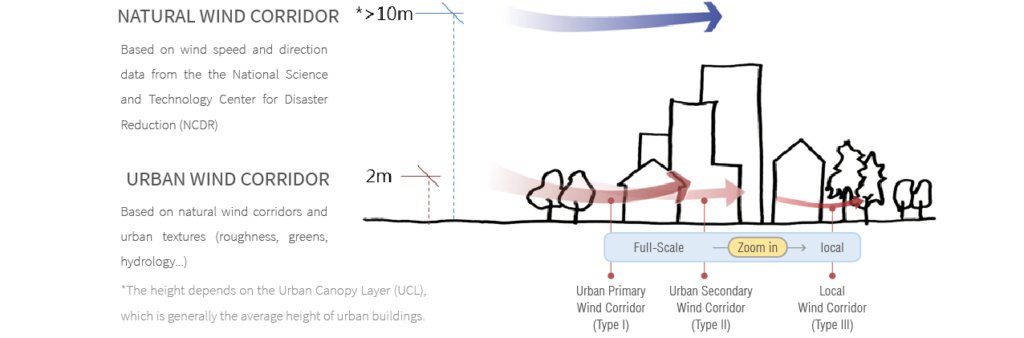
In this research, the wind corridors had been distinguished into two types: natural and urban wind corridors.
A natural wind corridor is a specific wind flow from low to high temperatures, driven by temperature gradient and pressure gradient, and shaped by topography. It is also subject to primary circulation (global wind systems), secondary circulation (air masses, fronts…), and local circulation (sea-land breezes…).
When the natural wind corridor enters the city and flows through areas of low wind resistance, the wind paths are called “urban wind corridors” if they are connected continuously. Areas of the city with higher wind resistance (e.g. buildings, artificial embankments, etc.) wou;d block the natural wind and flow into areas with less wind resistance (e.g. green spaces, water areas, squares, driveways, etc.) and would be adjusted according to the natural wind corridor or prevailing winds in the area.
A full-scale urban wind corridors are divided into Primary and Secondary Wind Corridors according to their ventilation capacities. If the scale of the study is zoomed into a local area, the corridor is defined as a Local Wind Corridor, also called a Type III Corridor.
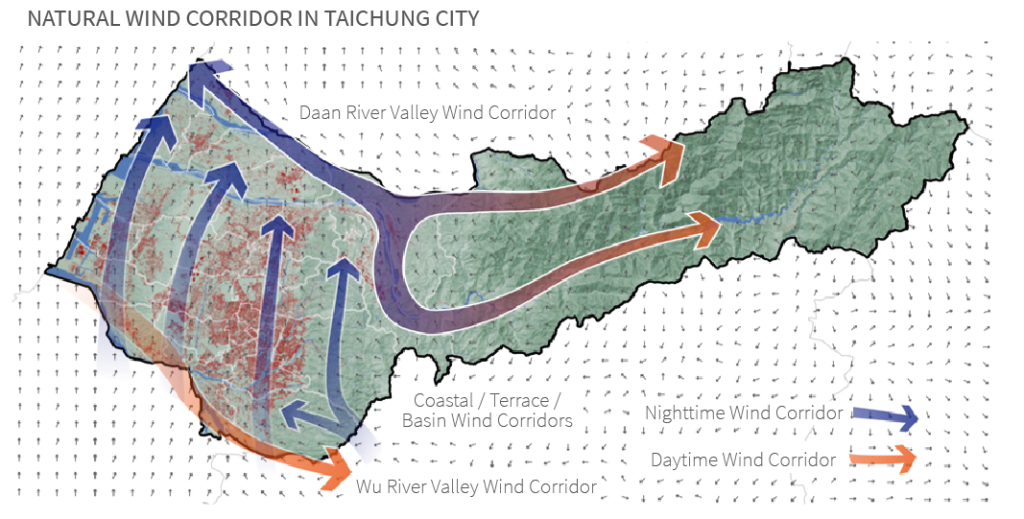
The natural wind corridor in summer throughout Taichung has the following characteristics:
- Daan River Valley Wind Corridor: A Y-shaped wind corridor from the Daan River and the Dajia River upstreams, meet and merge at middlestreams, blowing between the land to the sea.
- Coastal / Terrace / Basin Wind Corridors: Wind corridors flows from Sorth to Nouth at night.
- Wu River Valley Wind Corridor: A wind corridor blowing from sea to the land in the daytime.
ROUGHNESS LENGTH
If we assume that the wind comes from the same direction in a city, the wind from different starting points on the same cross-section would flow through different densities of obstructions. Based on the total path length it goes and the remaining wind speed, a smoother route is more likely to be considered as an urban wind corridor.
The roughness length (RL) measures the degree of undulation above ground level within an area, and the ability of slowing down the wind flowing through. We use this parameter to determine urban wind corridors. To compare the differences between areas, we subdivide the urban area into grids of 500 square metre, and calculated the RL of each grid individually.
The formula used to determine the roughness length of the wind corridor for this project is:
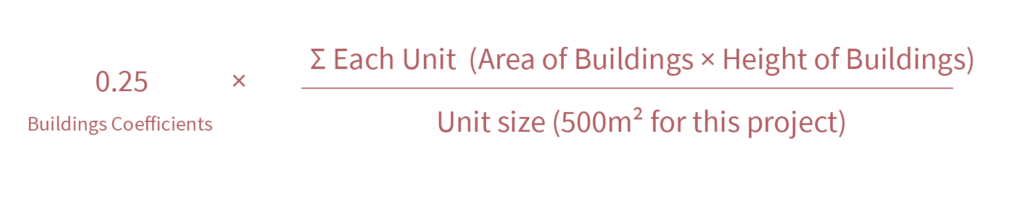
If the wind is likened to runners, roughness is like the hurdles. A lower RL value allows the wind to pass easily.
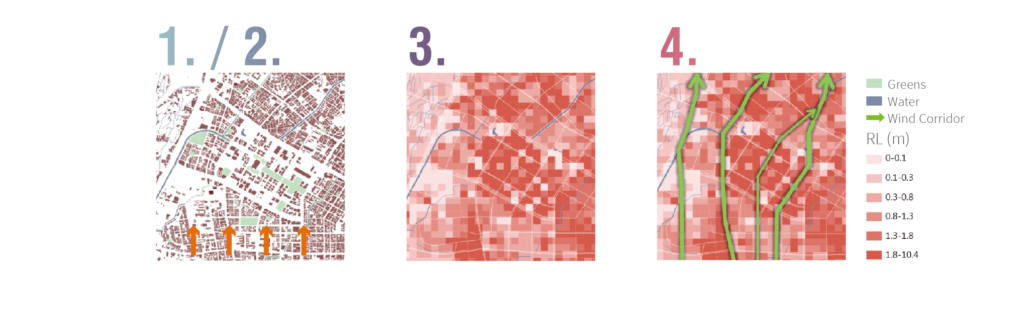
We have therefore defined the urban wind corridor configuration:
- The prevailing summer winds in the area are defined based on long-term wind speed and direction information.
- Map the building area and height parameters in the geographic information system (GIS). The blank spaces are roads or open spaces, such as plaza, parks…
- Calculate the RL value. The greater the roughness, the darker the visualisation, the less likely the wind would pass through.
- Finally, assume that the wind prefer to pass through the path of less resistance. By least cost path (LCP) theory, the potential wind corridor paths can be plotted from south to north.
IDENTIFYING THE FULL-SCALE URBAN WIND CORRIDORS
This is an example of the identification process of urban wind corridors in Taichung City.
- Wind in summer at night (mainly from the South) is used as the reference wind direction for the urban wind corridor in this case.
- The cooling effect of urban wind corridor mainly affects the dense areas. We have therefore defined the study domain as 20 x 20 square kilometres of Taichung City center, a dense built environment.
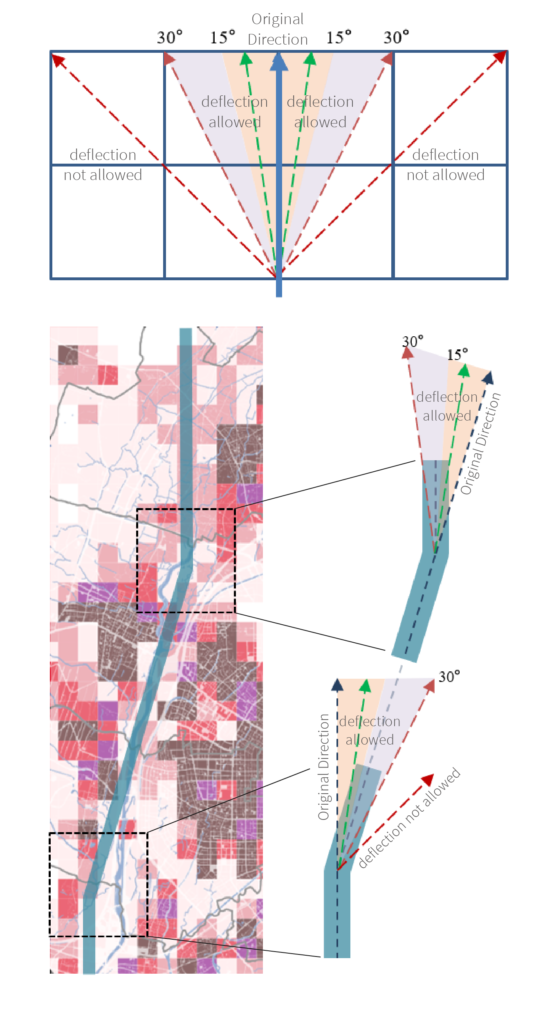
- Assume the low RL length (<1 m) facilitated the wind passage, and that the urban wind corridors deflect in advance when encountering large areas of high roughness (>2 m, in this case) built-up areas.
- The angle of the wind deflection should not exceed 30° (according to a Japanese research of wind corridors).
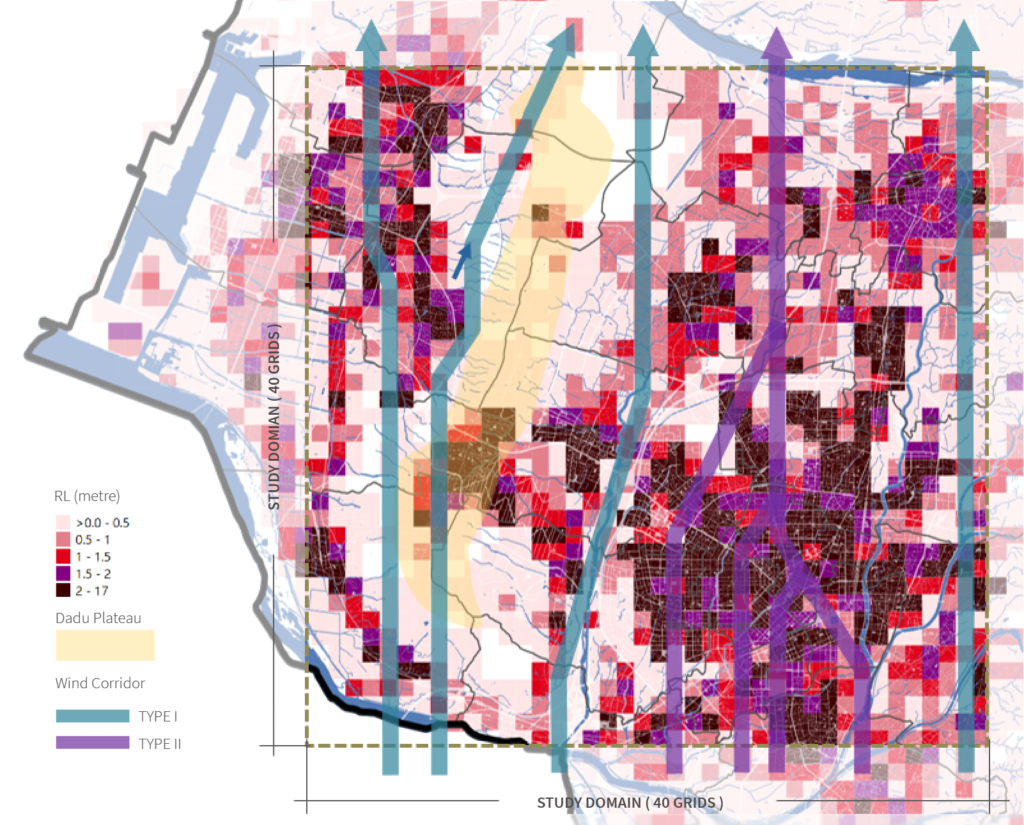
To define the Primary and Secondary Wind Corridor, we calculate the number of high-RL-value grids that each route passes through. If a wind corridor flows alone the rougher route, then it become weaker.
According to the ratio of high RL(>1m) grids*, it is classified as follows:
Type II Wind Corridor: 35%~50%
Type I Wind Corridor:<35%
The explicited formula is given by:
*P (%)= N / T
P : Ratio.
N : The number of high RL grids the wind passes through.
T : The number of grids in the North South direction* of the study domain (40 in this case).
*The direction is case dependant.
IDENTIFYING THE LOCAL URBAN WIND CORRIDORS
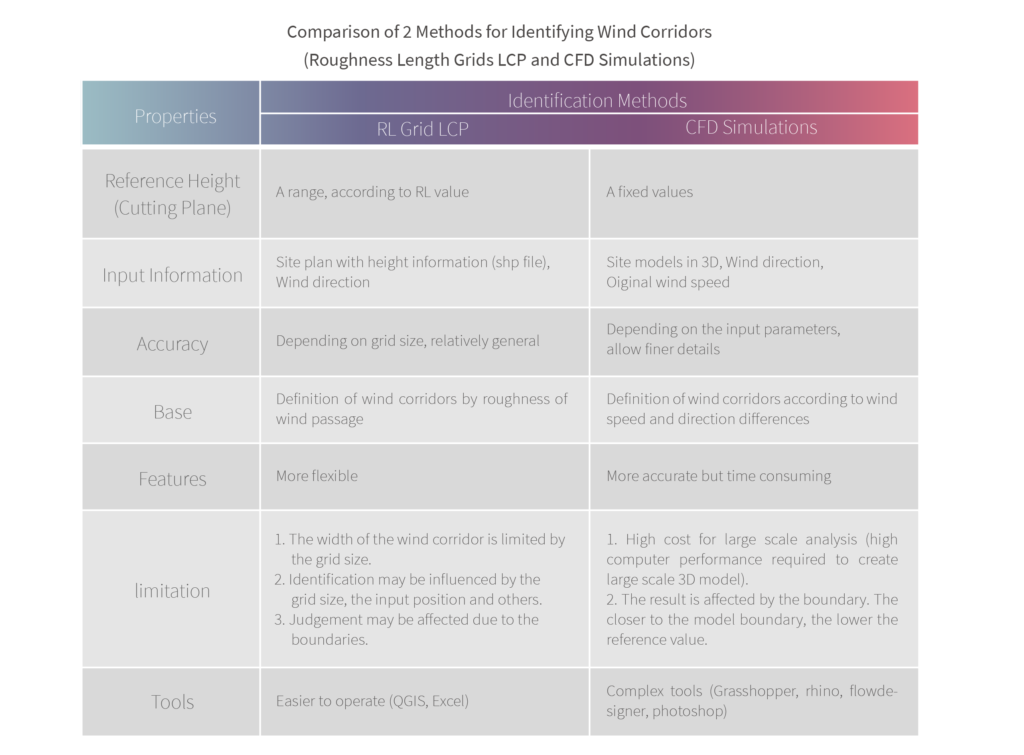
Type III Wind Corridors are used to reduce the scale of study to a smaller block for the more specific implementation of the heat mitigation strategy. At this scale, Computational Fluid Dynamics (CFD) simulations were allowed to used to simulate the impact and variability of different cooling strategies on the environment, using the microclimate measurements as input parameters, which enable us to confirm the effectiveness of the cooling strategy.
Our first step, identifying the local urban wind corridors, is the same as doing the full-scale ones. The reference grid size was based on the studying domain. We found that refining the side lengths of the grid in the domain of interest (e.g. 20 m² , see the upper left figure) and generalising the outer area (100 x 100 m², see the upper left figure) led to very efficient judgement information.
In the result of the CFD simulations, we eliminated the areas where the wind speed was too low, then identified the unobstructed paths with a width greater than 10m as wind corridors. The CFD simulations were then manipulated with the aim of verifying the above steps. It can of course be used as an accreditation method for wind corridors, but we have confirmed that it is more costly.
POTENTIAL APPLICATIONS AFTER THE IDENTIFICATION OF THE URBAN WIND CORRIDOR
- 60 metres on either side of the route of wind corridor is designated as a “Wind Corridor Regulated Zone”.
- The junction of wind corridors is proposed as an “Enhanced Regulated Zone” if there are two or more wind corridors passing through.
- The regulated zone will be subject to ventilation adjustment strategies, such as buildings setback, widening gap of buildings and review of site ventilation rate (SVR), which will be investigated and verified by CFD simulations.
The range of regulated zone is based on overseas researches and Taichung’s climate features. The road width with 60 metres on either side can form an 150 metres width wind corridor, which lead to a better ventilation effect. The effect of different widths on ventilation can be further evaluated by CFD simulations.